Pennsylvania Hospital Trends 1990-1996


  Graph 1: Total Patient Days
  • Total patient days for large general acute hospitals have declined steadily since 1992.
  Graph 2: Total Patient Days (Other Hospital Types)
  • Total Patient Days for large general acute hospitals have declined steadily since 1992.
  • Among other hospitals types, Psychiatric hospitals have experienced the sharpest decline in total patient days.
  • Total patient days for Childrens’ and Specialty hospitals have remained fairly constant since 1990.
  
  Graph 3: Total Discharges
  • Total discharges for both large and small general acute hospitals have declined steadily since 1992.
  Graph 4: Occupancy Rate
  • The combination of falling admissions and decreasing patient days has produced declining occupancy rates for both large and small general acute care hospitals.
  • The sharp drop in the occupancy rate for small general acute care hospitals from 1995 to 1996 affected eight of the nine hospital regions in Pennsylvania.

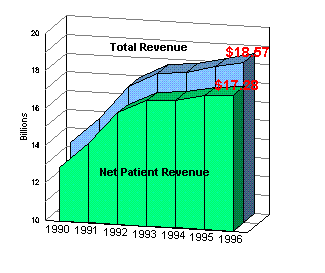
  Graph 5: Total Revenue and Net Patient Revenue
  • Total revenues for all hospitals increased by 1.9% to $18.57 billion.
  • Patient revenues for all hospitals increased by 0.8% to $17.28 billion.
  • Patient revenues for GAC hospitals increased by 1.1%, the smallest increase in six years.
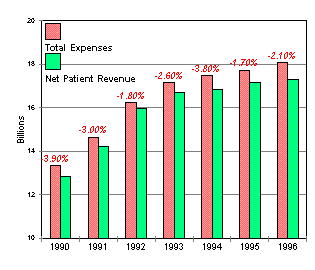
  Graph 6: Net Patient Revenue and Total Expenses
  • Total expenses increased to $18.1 billion in 1996.
  • Expenses increased by 2.0% in 1996, the largest increase in three years.
  • Patient revenues did not keep up with the growth in expenses, increasing only 0.8%.
  • This gap between patient revenue and expenses is expressed by the core margin which was -2.1% in 1996, compared to -1.7% in 1995.
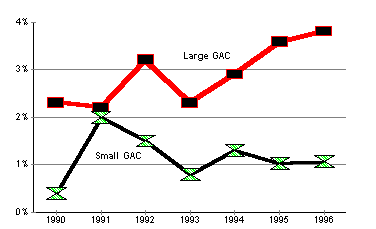
  Graph 7: Net Margin
  • Net margins for large GAC hospitals have steadily increased since 1993.
  • Small GAC hospitals continue to operate with smaller margins, although net margins increased slightly in 1996.
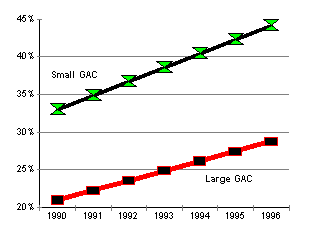
  Graph 8: Outpatient Revenue Percentage
  • The percentage of outpatient revenue has increased steadily since 1990.
  • The proportion of outpatient revenue for small GAC was 1.5 times that for large GAC hospitals.