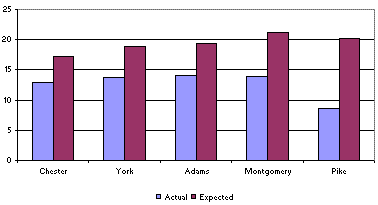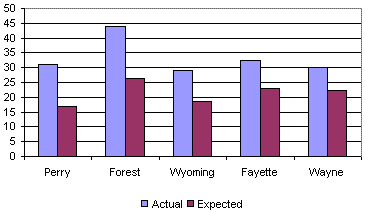
| County | Actual | Expected | % Above/Below | County | Actual | Expected | %Above/ Below | |
|---|---|---|---|---|---|---|---|---|
| Perry | 31.0 | 17.1 | 81.7% | Washington | 23.9 | 23.0 | 3.8% | |
| Forest | 43.8 | 26.5 | 65.2% | Allegheny | 23.6 | 22.9 | 2.9% | |
| Wyoming | 29.0 | 18.4 | 57.5% | Monroe | 18.0 | 17.7 | 1.5% | |
| Fayette | 32.4 | 23.1 | 40.6% | Montour | 21.5 | 21.3 | 0.8% | |
| Wayne | 29.9 | 22.1 | 35.1% | Butler | 18.6 | 18.8 | -1.3% | |
| Philadelphia | 26.8 | 19.8 | 34.9% | Warren | 21.1 | 21.8 | -2.9% | |
| Indiana | 25.6 | 19.2 | 33.6% | Northumberland | 23.6 | 24.3 | -2.9% | |
| Cameron | 32.1 | 24.2 | 32.3% | McKean | 20.6 | 21.5 | -4.1% | |
| Schuylkill | 31.9 | 24.8 | 28.8% | Dauphin | 18.9 | 19.7 | -4.2% | |
| Mifflin | 27.0 | 21.5 | 25.7% | Snyder | 17.5 | 18.4 | -5.1% | |
| Huntingdon | 24.2 | 19.6 | 23.7% | Centre | 13.4 | 14.2 | -6.0% | |
| Clarion | 23.7 | 19.3 | 23.1% | Greene | 19.0 | 20.4 | -6.8% | |
| Crawford | 24.1 | 20.3 | 18.9% | Elk | 20.0 | 21.7 | -7.7% | |
| Juniata | 23.6 | 20.0 | 18.1% | Delaware | 18.9 | 20.8 | -8.8% | |
| Lawrence | 27.9 | 23.9 | 16.9% | Sullivan | 23.8 | 26.2 | -9.1% | |
| Carbon | 27.5 | 23.7 | 16.4% | Susquehanna | 18.5 | 20.5 | -9.5% | |
| Clearfield | 25.3 | 21.8 | 16.0% | Bradford | 17.8 | 20.3 | -12.2% | |
| Armstrong | 26.3 | 22.9 | 14.6% | Lycoming | 17.4 | 20.5 | -15.3% | |
| Cambria | 27.3 | 24.2 | 12.8% | Bucks | 14.8 | 17.6 | -15.5% | |
| Northampton | 22.7 | 20.3 | 11.8% | Erie | 15.8 | 19.1 | -17.1% | |
| Luzerne | 27.8 | 25.0 | 11.1% | Potter | 17.2 | 21.1 | -18.4% | |
| Columbia | 22.9 | 20.7 | 10.9% | Lebanon | 17.4 | 21.3 | -18.5% | |
| Union | 19.2 | 17.3 | 10.8% | Tioga | 16.9 | 20.8 | -18.7% | |
| Venango | 23.2 | 21.2 | 9.5% | Cumberland | 16.0 | 19.7 | -18.8% | |
| Fulton | 21.6 | 19.7 | 9.4% | Berks | 16.9 | 20.8 | -18.8% | |
| Jefferson | 23.5 | 22.0 | 7.0% | Lehigh | 17.2 | 21.4 | -19.4% | |
| Somerset | 24.1 | 22.6 | 6.6% | Franklin | 16.4 | 20.5 | -19.8% | |
| Beaver | 24.2 | 22.8 | 5.9% | Bedford | 16.8 | 21.7 | -22.7% | |
| Blair | 23.0 | 21.7 | 5.8% | Lancaster | 14.1 | 18.7 | -24.6% | |
| Westmoreland | 24.4 | 23.1 | 5.6% | Chester | 13.0 | 17.3 | -24.9% | |
| Lackawanna | 25.5 | 24.5 | 4.4% | York | 13.8 | 18.8 | -26.9% | |
| Clinton | 22.3 | 21.3 | 4.3% | Adams | 14.0 | 19.3 | -27.5% | |
| Mercer | 23.7 | 22.7 | 4.1% | Montgomery | 13.9 | 21.3 | -34.7% | |
| Pike | 8.6 | 20.2 | -57.4% |
* County rates are sex and age adjusted and per 1,000. Expected rates are calculated based on the Pennsylvania rate of 20.84 hospitalizations per 1,000.


 Facebook