| *Average severity refers to the level of illness severity upon admission to the hospital. Atlas Outcomes TM, a product of MediQual Systems, Inc. is used to collect and calculate these average patient severity scores. | |||||||
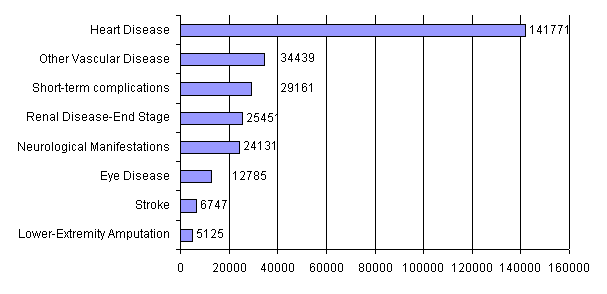
| CASES | DOLLARS | DAYS | AVERAGE | MORTALITY | AVERAGE | ||
|---|---|---|---|---|---|---|---|
| Complication | # | Total | Total | Dollars | Days | % | Severity* |
| Short-term complications | 29,161 | $466,547,557 | 210,980 | $15,999 | 7.2 | 2.8% | 1.5 |
| Lower-Extremity Amputation | 5,125 | $155,545,596 | 62,353 | $30,350 | 12.2 | 3.8% | 1.9 |
| Renal Disease-End Stage | 25,451 | $556,679,899 | 206,019 | $21,873 | 8.1 | 5.7% | 2.1 |
| Eye Disease | 12,785 | $228,491,784 | 90,088 | $17,872 | 7.0 | 2.5% | 1.8 |
| Heart Disease | 141,771 | $2,552,681,436 | 917,804 | $18,006 | 6.5 | 4.2% | 1.9 |
| Stroke | 6,747 | $100,618,265 | 52,090 | $14,913 | 7.7 | 6.3% | 2.1 |
| Neurological Manifestations | 24,131 | $418,021,310 | 187,577 | $17,323 | 7.8 | 2.5% | 1.8 |
| Other Vascular Disease | 34,439 | $687,528,338 | 280,703 | $19,964 | 8.2 | 3.6% | 1.9 |

 Facebook