Medicare and Medicaid Plans
Figure 4: Actual Expected (Post-Surgical) Length of Stay, by Health Plan, 1994-1995
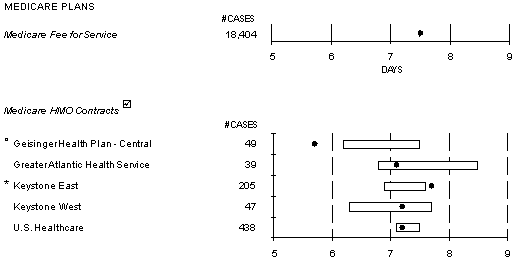

☑ Includes only Medicare patients
Key
- * - Actual Mortality significantly higher than Expected
- ● - Actual Mortality Rate
- □ - Actual Mortality significantly lower than Expected
- ⃞ - Range of Expected Mortality


 Facebook
 Mobile