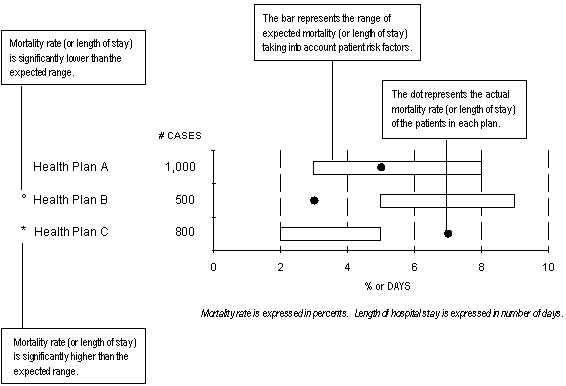

Note: The graphs in this report allow you to compare actual mortality and length of stay with an expected range, which is determined by both volume and diversity of patient risk. The expected range is expressed as a percent for mortality and in days for length of stay. More patients and/or less diversity of risk will result in a shorter bar.
 Facebook